Empower Your Predictive Maintenance Strategy with a Smarter Way to Explore Historical Data.
Timelines in TWave T8 make it easy to navigate stored data over time ⏳
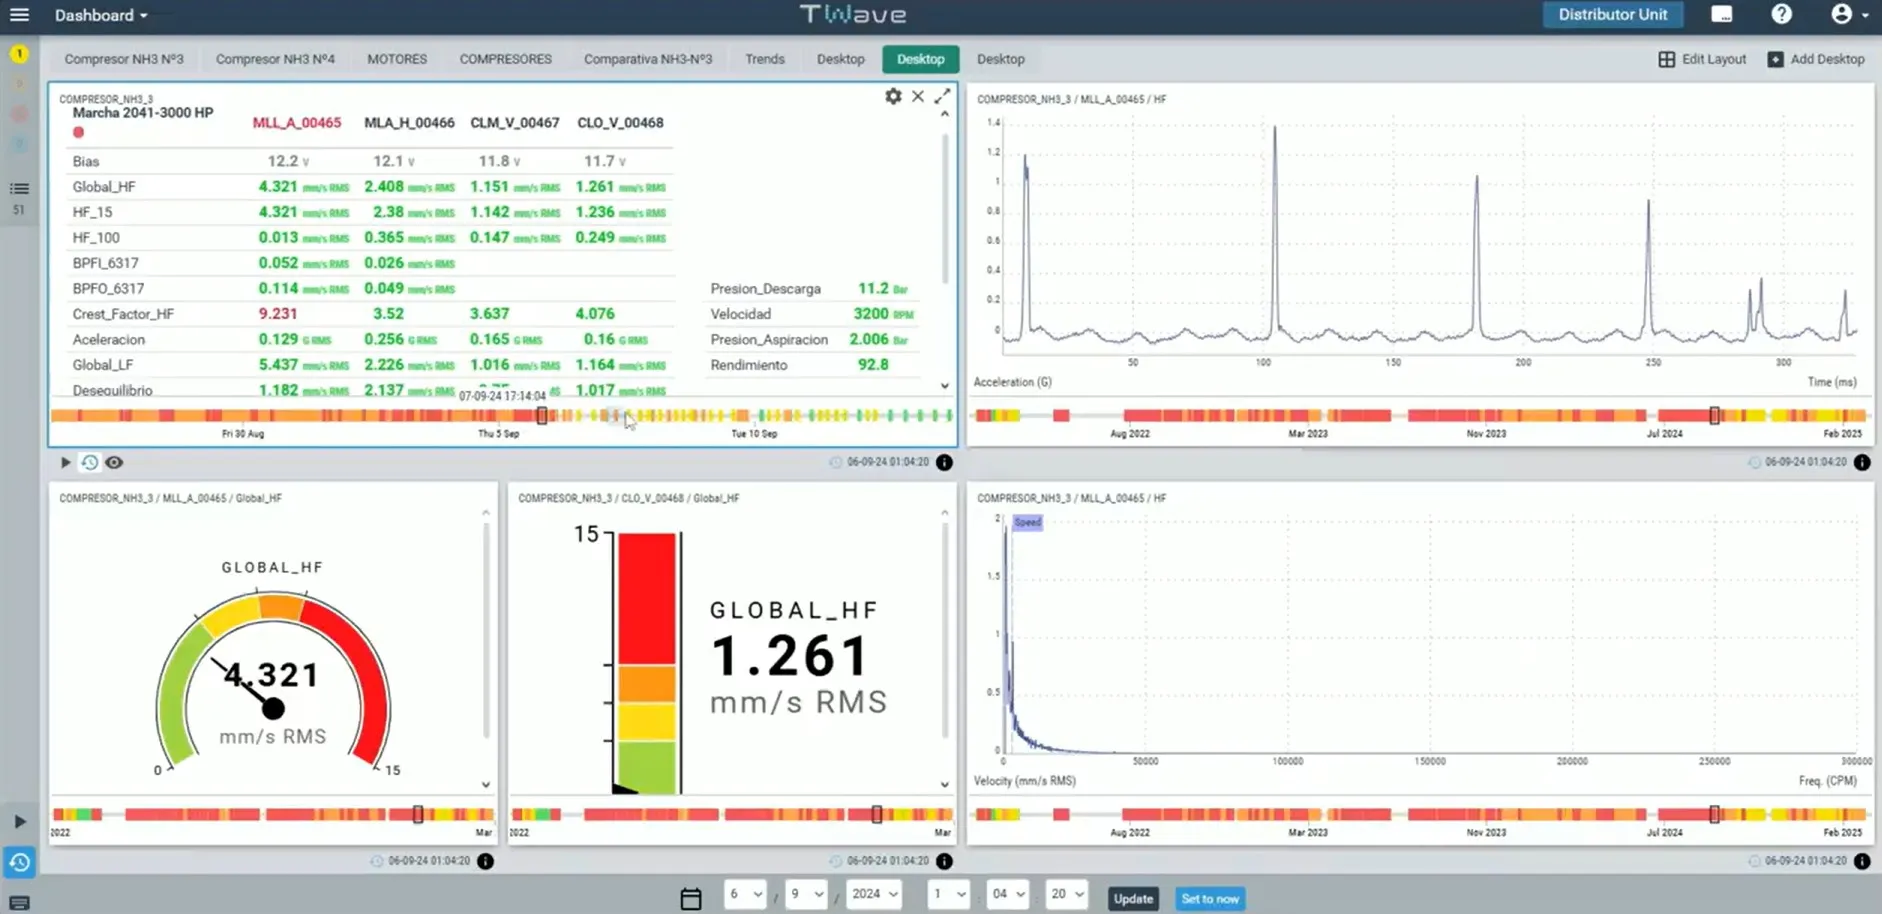
Each historical capture appears as a color-coded vertical bar on the timeline, showing the machine’s alarm status at that moment. Just click on a bar, and the plot updates instantly with the corresponding measurements from that specific date and time.
Where Can You Use Timelines?
- Trends
- Waveforms
- Spectrums
- Parameter Matrix
- Online Values
- Mimic
🔍 Filter by Machine or Alarm Status Easily refine your historical data view by filtering captures based on machine status or alarm conditions. Hide non-matching states and focus only on the most relevant data.
🕑 Global Timeline: Everything in Sync One of the standout features of TWave T8 is the Global Timeline, which keeps all widgets synchronized. Select a snapshot in one widget, and all others update automatically to show data from the same exact moment, making comparisons effortless.
Boost your predictive maintenance strategy with TWave T8!